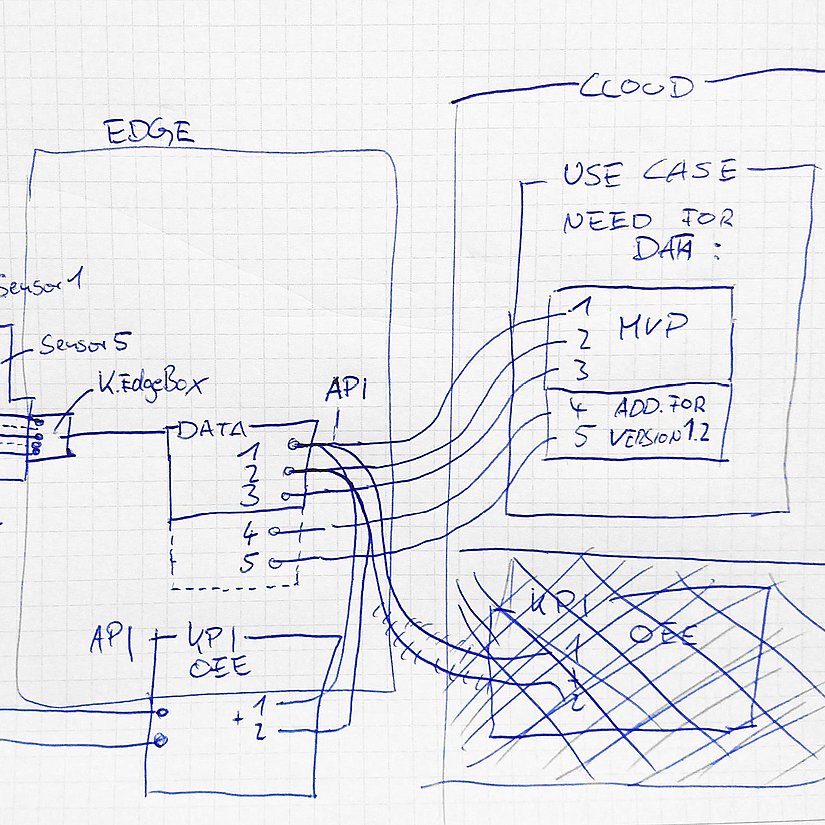
During the first pitches at the group-wide sprints focusing on the smart factory, I knew: We have to implement this — fast!” says Jens Delventhal as he recalls the start of the joint work. Steffen Cords also likes to look back at the early days. On his smartphone he still has a photo of the first ballpoint-pen sketch of his idea. It consists of a couple of boxes and a couple of data cables. If you squint a little, it almost looks like a machine. At the bottom left of the sketch is an element that is often neglected in traditional product development: the human being who is supposed to use this thing.

Article
Start with the simplest solution
According to both, that was on July 22, 2017. The next photo is dated October 2, 2017. It shows an empty office in a co-working space in Hamburg. No computer, no telephone, and no people. Scrawled on the glass wall in chalk is a message: “82 days to launch.”
This means the team went from the initial idea to the minimum viable product (MVP) in use by the customer in just three months. “That was an ambitious goal,” says Delventhal, Vice President Product Development at Körber Digital, with a touch of pride. “But we knew we had the know-how, the skills, and the passion we needed to reach this goal.”
Digital Shift Analytics combines the know-how of machine operators with the live data from shift operations to form a comprehensive picture — something that was not possible in the past. It answers a number of questions, such as: Why was the production process slower than usual during the last shift? Where did dropouts, malfunctions or production stoppages occur? What can we deduce from this information in order to improve the next shifts? What kinds of problems should we expect to see at specific machines and when? How can we prepare to deal with them? Which spare parts should we have on hand?
“Today many companies are talking about condition monitoring or predictive maintenance without knowing what they really need,” says Cords. He studied shipbuilding and subsequently worked in the field of social research and futurology before joining Körber Digital, where he is the Head of Ideation and Scouting and is in charge of the early phase of innovations. “In many cases, companies set up development programs and work on solutions that are much too complex and therefore often dropped within three years or less,” he says.


The daily check: What’s the status quo?
The situation is different with Digital Shift Analytics. This software is already being used by a hygiene paper manufacturer in factories in various locations across Europe. Several customers from the Group’s Business Areas Tissue and Logistics Systems are also interested in this solution and have started testing it. And the Digital Shift Analytics office at Körber Digital’s Berlin location is extremely full. “Thanks to the cooperation of three Business Areas, we developed our first product to the MVP phase in practically no time at all. Now that we’ve got this product in real operation and are continually enhancing it, we’ve reinforced the team once again,” Delventhal says. At today’s daily stand-up meeting, colleagues are taking turns to describe what they have accomplished during the current sprint, what they are working on at the moment, and what’s holding up progress. Some of the colleagues are physically present, while others are participating online. In agile projects like this one, distributed working is normal.
lAfter the machine operators realized that we really wanted to learn from them, they developed trust.r
Steffen Cords, Head of Ideation and Scouting at Körber Digital
Cords continues his story about the early days. “I’ll never forget the experience of standing in our customer’s factory for the first time and seeing all the things that start happening at the moment when these gigantic paper rolls are delivered, what the machines do with the paper, what kind of technology is involved, and what kinds of process steps are used,” he says. From the very first day on, this kind of detailed understanding has been the basis of Digital Shift Analytics. And this understanding is gained primarily by talking with the people who operate the machines. “Initially they were mainly skeptical. But after they realized that we really wanted to learn from them, that we were designing all this software for them, and that they could really influence the design of the interface, they developed trust.”
One of the secrets behind the success of Digital Shift Analytics is a rule from the field of design thinking: When you’re developing something, always keep in mind the user who will be working with it every day. Another important principle is: Start with the simplest solution. “We carried out the first tests at our Fabio Perini factory in Lucca. Then we took some simple hardware to our pilot customer’s factory, where we recorded only one measured value of the machine: its speed. Nothing more,” says Delventhal.
That doesn’t sound like big data at all. “But you can use it as a foundation for many other things — for example, answers to questions such as: Why were there fluctuations in the operating speed? Is this the beginning of a problem? Why was there a stoppage?” This is where the machine operators come into play. The Digital Shift Analytics team worked together with them to develop a touchscreen interface where the operators can record events and enter their observations during a shift. “We use this information to look for and identify patterns.”

Data becomes images
“This is more or less the way that companies train their software for autonomously driving cars,” Cords explains. “Have you ever logged onto a website and had to solve picture puzzles by clicking on the photos where you can see a store, bridge, or bike?” In the same way, algorithms recognize patterns in the images captured by the vehicle’s camera. Digital Shift Analytics uses the entries of the machine operators to detect patterns in the fluctuations of the operating speed. “Today we are recording many more parameters, which we can use to construct fairly complex models and predictions,” Cords adds.
The more extensive and varied the data are, the tougher it is to visualize them. “In addition to the support we’re providing to the shift workers, we’re focusing on data analyses for the engineers who bear overall responsibility for the machines’ performance at the moment,” says the interface designer Gerardo Lopez. How much information on the display is too much? Which data should be emphasized? Where do graphics help and where are they a distraction? It’s also very important to make sure the users can directly see where they can intervene to solve problems.
“We have a very strong focus on precisely understanding the users: their age, their visual habits, and how tech-savvy they are,” says Lopez. Here too, nothing works without interviews, according to Raza Aslam, the product owner who manages the daily operations at Digital Shift Analytics: “We go to the factory every few weeks, and we talk to the machine operators there. This is a vital part of the process.”
One reason for this is that the potential of Digital Shift Analytics is far from being fully exploited. “We will soon be able to support the machine operators’ work even more effectively by means of automated recommendations for optimization,” says Delventhal. “Things are becoming really exciting right now.”
Share this article
Back to top